Prometheus
Installation
To begin, we create a working area (directory) and enter it:
root@server:~# mkdir work
root@server:~# cd work
root@server:~/lucru#
In this directory, we will download the archive with the necessary files, but first, we will copy the link from the page :
root@server:~/lucru# wget https://github.com/getgrav/grav/releases/download/1.7.46/grav-admin-v1.7.46.zipUpon completion of the download, we extract the archive:
root@server:~/lucru# tar -xvf prometheus-2.53.1.linux-amd64.tar.gz
prometheus-2.53.1.linux-amd64/
prometheus-2.53.1.linux-amd64/prometheus.yml
prometheus-2.53.1.linux-amd64/prometheus
prometheus-2.53.1.linux-amd64/consoles/
prometheus-2.53.1.linux-amd64/consoles/node-disk.html
prometheus-2.53.1.linux-amd64/consoles/node-overview.html
prometheus-2.53.1.linux-amd64/consoles/node-cpu.html
prometheus-2.53.1.linux-amd64/consoles/node.html
prometheus-2.53.1.linux-amd64/consoles/prometheus-overview.html
prometheus-2.53.1.linux-amd64/consoles/index.html.example
prometheus-2.53.1.linux-amd64/consoles/prometheus.html
prometheus-2.53.1.linux-amd64/LICENSE
prometheus-2.53.1.linux-amd64/promtool
prometheus-2.53.1.linux-amd64/console_libraries/
prometheus-2.53.1.linux-amd64/console_libraries/menu.lib
prometheus-2.53.1.linux-amd64/console_libraries/prom.lib
prometheus-2.53.1.linux-amd64/NOTICE
After extraction, we create the necessary directories where the downloaded files will be copied:
root@server:~/lucru# mkdir -p /etc/prometheus
root@server:~/lucru# mkdir -p /var/lib/prometheus
We copy the binaries to the directory /usr/local/bin, and the configuration files to /etc/prometheus, as follows:
root@server:~/lucru# cd prometheus-2.53.1.linux-amd64/
root@server:~/lucru/prometheus-2.53.1.linux-amd64# cp prometheus promtool /usr/local/bin
root@server:~/lucru/prometheus-2.53.1.linux-amd64# cp prometheus.yml /etc/prometheus/prometheus.yml
root@server:~/lucru/prometheus-2.53.1.linux-amd64# cp -r consoles/ console_libraries/ /etc/prometheus/
We will test what has been accomplished so far:
root@server:~/lucru/prometheus-2.53.1.linux-amd64# cd ~
root@server:~#
root@server:~# ls /etc/prometheus/
console_libraries  consoles  prometheus.yml
root@server:~# prometheus --version
prometheus, version 2.53.1 (branch: HEAD, revision: 14cfec3f6048b735e08c1e9c64c8d4211d32bab4)
  build user:       root@9f8e5b6970da
  build date:       20240710-10:16:27
  go version:       go1.22.5
  platform:         linux/amd64
  tags:             netgo,builtinassets,stringlabels
root@server:~# promtool --version
promtool, version 2.53.1 (branch: HEAD, revision: 14cfec3f6048b735e08c1e9c64c8d4211d32bab4)
  build user:       root@9f8e5b6970da
  build date:       20240710-10:16:27
  go version:       go1.22.5
  platform:         linux/amd64
  tags:             netgo,builtinassets,stringlabels
root@server:~#
For safety, the necessary permissions for the created files and directories will be set. Thus, a group prometheus and a user prometheus will be created, which will be part of the prometheus group, but will not have login and console rights on the computer:
root@server:~# groupadd --system prometheus
root@server:~# useradd -s /sbin/nologin --system -g prometheus prometheus
We check:
root@server:~# cat /etc/group | grep prometheus
prometheus:x:989:
root@server:~# cat /etc/passwd | grep prometheus
prometheus:x:995:989::/home/prometheus:/sbin/nologin
We set the permissions for the directories /etc/prometheus and /var/lib/prometheus:
root@server:~# chown -R prometheus:prometheus /etc/prometheus/ /var/lib/prometheus/
root@server:~# chmod -R 775 /etc/prometheus/ /var/lib/prometheus/
We check:
root@server:~# ls -la /etc/prometheus/
total 20
drwxrwxr-x   4 prometheus prometheus 4096 iul 30 10:12 .
drwxr-xr-x 106 root       root       4096 iul 30 09:59 ..
drwxrwxr-x   2 prometheus prometheus 4096 iul 30 10:12 console_libraries
drwxrwxr-x   2 prometheus prometheus 4096 iul 30 10:12 consoles
-rwxrwxr-x   1 prometheus prometheus  934 iul 30 09:43 prometheus.yml
root@server:~# ls -la /var/lib/prometheus/
total 8
drwxrwxr-x  2 prometheus prometheus 4096 iul 30 09:32 .
drwxr-xr-x 43 root       root       4096 iul 30 09:32 ..
root@server:~#
Before creating the necessary configuration file for systemd, so that prometheus can start as a service, we will check if the port 9090/tcp used by default by prometheus is free and not used by any previously installed service:
root@server:~# netstat -tulpn | grep 9090
tcp6       0      0 :::9090                 :::*                    LISTEN      395/java
root@server:~# ps -ax | grep 395
    395 ?        Ssl    5:17 java -Xmx3072m -XX:+UseG1GC -XX:+HeapDumpOnOutOfMemoryError -XX:HeapDumpPath=/tmp -Djdk.tls.ephemeralDHKeySize=2048 -Djdk.net.usePlainDatagramSocketImpl=true -Dconfig.file=/etc/jitsi/videobridge/jvb.conf -Dnet.java.sip.communicator.SC_HOME_DIR_LOCATION=/etc/jitsi -Dnet.java.sip.communicator.SC_HOME_DIR_NAME=videobridge -Dnet.java.sip.communicator.SC_LOG_DIR_LOCATION=/var/log/jitsi -Djava.util.logging.config.file=/etc/jitsi/videobridge/logging.properties -cp /usr/share/jitsi-videobridge/jitsi-videobridge.jar:/usr/share/jitsi-videobridge/lib/* org.jitsi.videobridge.MainKt
As observed, it is not free as it is being used by a java application related to the Jitsi Video Conferencing service. In this case, I will check if the following port 9091 is free, as it is commonly used by torrent applications. We check here to see which applications use the ports by default:
oot@server:~# netstat -tulpn | grep 9091
root@server:~#
As observed, the port is not in use, so I will use this one.
We will create, with the help of our preferred editor, the configuration file necessary for systemd to start the prometheus service:
root@server:~# nano /etc/systemd/system/prometheus.service In which we will add the following lines:
[Unit]
Description=Prometheus
Wants=network-online.target
After=network-online.target

[Service]
User=prometheus
Group=prometheus
Restart=always
Type=simple
ExecStart=/usr/local/bin/prometheus \
    --config.file=/etc/prometheus/prometheus.yml \
    --storage.tsdb.path=/var/lib/prometheus/ \
    --web.console.templates=/etc/prometheus/consoles \
    --web.console.libraries=/etc/prometheus/console_libraries \
    --web.listen-address=:9091

[Install]
WantedBy=multi-user.target
We also change the port number in the configuration file located at /etc/prometheus/prometheus.yml:
root@server:~# nano /etc/prometheus/prometheus.ymlFor me, the file looks like this:
# my global config
global:
  scrape_interval: 15s # Set the scrape interval to every 15 seconds. Default is every 1 minute.
  evaluation_interval: 15s # Evaluate rules every 15 seconds. The default is every 1 minute.
  # scrape_timeout is set to the global default (10s).

# Alertmanager configuration
alerting:
  alertmanagers:
    - static_configs:
        - targets:
          # - alertmanager:9093

# Load rules once and periodically evaluate them according to the global 'evaluation_interval'.
rule_files:
  # - "first_rules.yml"
  # - "second_rules.yml"

# A scrape configuration containing exactly one endpoint to scrape:
# Here it's Prometheus itself.
scrape_configs:
  # The job name is added as a label `job=<job_name>` to any timeseries scraped from this config.
  - job_name: "prometheus"

    # metrics_path defaults to '/metrics'
    # scheme defaults to 'http'.

    static_configs:
      - targets: ["localhost:9091"]
Now we will start and set it to start at boot time:
root@server:~# systemctl enable --now prometheus.service
Created symlink /etc/systemd/system/multi-user.target.wants/prometheus.service → /etc/systemd/system/prometheus.service.
We check that prometheus has started and everything is okay:
 root@server:~# systemctl enable --now prometheus.service
Created symlink /etc/systemd/system/multi-user.target.wants/prometheus.service → /etc/systemd/system/prometheus.service.
root@server:~# systemctl status prometheus.service
● prometheus.service - Prometheus
     Loaded: loaded (/etc/systemd/system/prometheus.service; enabled; preset: enabled)
     Active: active (running) since Tue 2024-07-30 10:47:20 EEST; 2min 3s ago
   Main PID: 49848 (prometheus)
      Tasks: 8 (limit: 9254)
     Memory: 20.7M (peak: 21.2M)
        CPU: 194ms
     CGroup: /system.slice/prometheus.service
             └─49848 /usr/local/bin/prometheus --config.file=/etc/prometheus/prometheus.yml --storage.tsdb.path=/var/lib/prometheus/ --web.console.templates=/etc/prometheus/consoles --web.console.libraries=/etc/prometheus/console_librarie>

iul 30 10:47:20 server prometheus[49848]: ts=2024-07-30T07:47:20.395Z caller=head.go:721 level=info component=tsdb msg="Replaying WAL, this may take a while"
iul 30 10:47:20 server prometheus[49848]: ts=2024-07-30T07:47:20.395Z caller=head.go:793 level=info component=tsdb msg="WAL segment loaded" segment=0 maxSegment=0
iul 30 10:47:20 server prometheus[49848]: ts=2024-07-30T07:47:20.395Z caller=head.go:830 level=info component=tsdb msg="WAL replay completed" checkpoint_replay_duration=73.549µs wal_replay_duration=302.035µs wbl_replay_duration=311ns chun>
iul 30 10:47:20 server prometheus[49848]: ts=2024-07-30T07:47:20.399Z caller=main.go:1169 level=info fs_type=EXT4_SUPER_MAGIC
iul 30 10:47:20 server prometheus[49848]: ts=2024-07-30T07:47:20.399Z caller=main.go:1172 level=info msg="TSDB started"
iul 30 10:47:20 server prometheus[49848]: ts=2024-07-30T07:47:20.399Z caller=main.go:1354 level=info msg="Loading configuration file" filename=/etc/prometheus/prometheus.yml
iul 30 10:47:20 server prometheus[49848]: ts=2024-07-30T07:47:20.400Z caller=main.go:1391 level=info msg="updated GOGC" old=100 new=75
iul 30 10:47:20 server prometheus[49848]: ts=2024-07-30T07:47:20.400Z caller=main.go:1402 level=info msg="Completed loading of configuration file" filename=/etc/prometheus/prometheus.yml totalDuration=850.001µs db_storage=2.16µs remote_st>
iul 30 10:47:20 server prometheus[49848]: ts=2024-07-30T07:47:20.400Z caller=main.go:1133 level=info msg="Server is ready to receive web requests."
iul 30 10:47:20 server prometheus[49848]: ts=2024-07-30T07:47:20.400Z caller=manager.go:164 level=info component="rule manager" msg="Starting rule manager..."
root@server:~#
Everything seems to be in order, our service is active and running, and there are no error messages.
If we have an active firewall, we must remember to configure it to allow access to the prometheus service, in case we want to connect from the outside. I use ufw, like this:
root@server:~# nano /etc/ufw/applications.d/prometheus-serverIn which we will add:
[Prometheus]
title=Prometheus
description=Prometheus is an open-source systems monitoring and alerting toolkit
ports=9091/tcp
We load the newly defined rule:
root@server:~# ufw allow Prometheus
Rule added
Rule added (v6)
root@server:~#
We check:
root@server:~# ufw status
Status: active

To                         Action      From
--                         ------      ----
OpenSSH                    ALLOW       Anywhere
Apache Full                ALLOW       Anywhere
Grafana                    ALLOW       Anywhere
Jitsi                      ALLOW       Anywhere
Prometheus                 ALLOW       Anywhere
OpenSSH (v6)               ALLOW       Anywhere (v6)
Apache Full (v6)           ALLOW       Anywhere (v6)
Grafana (v6)               ALLOW       Anywhere (v6)
Jitsi (v6)                 ALLOW       Anywhere (v6)
Prometheus (v6)            ALLOW       Anywhere (v6)

root@server:~# ufw app info Prometheus
Profile: Prometheus
Title: Prometheus
Description: Prometheus is an open-source systems monitoring and alerting
toolkit

Port:
  9091/tcp
root@server:~#
Now we should be able to connect with a browser to the address of the machine running prometheus on port 9091:
Securing the connection
Since access to the service can be done anonymously, we will secure the connection by introducing a username and a password, something like .htaccess and .htpasswd from the apache2 web service. We will use the official guide for configuration here . To generate the password, we need the python3-bcrypt package:
root@server:~# apt install python3-bcrypt
Se citesc listele de pachete... Terminat
Se construiește arborele de dependență... Terminat
Se citesc informațiile de stare... Terminat
Următoarele pachete NOI vor fi instalate:
  python3-bcrypt
0 înnoit(e), 1 nou instalat(e), 0 de eliminat și 0 neactualizat(e).
Este nevoie să descărcați 33,0 ko de arhive.
După această operație vor fi folosiți din disc încă 96,3 ko.
Luat:1 http://archive.ubuntu.com/ubuntu noble/main amd64 python3-bcrypt amd64 3.2.2-1build1 [33,0 kB]
Aduși: 33,0 ko în 1s (36,8 ko/s)
Se selectează pachetul neselectat anterior python3-bcrypt.
(Se citește baza de date ... 59757 de fișiere și directoare actualmente instalate.)
Se pregătește pentru despachetare .../python3-bcrypt_3.2.2-1build1_amd64.deb ...
Se despachetează python3-bcrypt (3.2.2-1build1) ...
Se configurează python3-bcrypt (3.2.2-1build1) ...
root@server:~#
We move to the working directory:
root@server:~# cd work
root@server:~/lucru#
In this directory, we will create a script file in python that will encrypt the password of the user admin:
root@server:~/lucru# nano gen_bcrypt_pass.pyWhere we will insert the following lines:
import getpass
import bcrypt

password = getpass.getpass("password: ")
hashed_password = bcrypt.hashpw(password.encode("utf-8"), bcrypt.gensalt())
print(hashed_password.decode())
After saving, we run the file and enter the password of the user admin to be encrypted:
root@server:~/lucru# python3 gen_bcrypt_pass.py
password:
$2b$12$hNf2lSsxfm0.i4a.1kVpSOVyBCfIB51VRjgBUyv6kdnyTlgWj81Ay
$2b$12$5ppEveW5ORJ83KQAIdC1AejIQl.e..BbtlIiyAkmW8hO6YGe47GJK
After that, we will create the configuration file web.yml in /etc/prometheus:
root@server:~/lucru# nano /etc/prometheus/web.ymlin which we will insert the following lines:
basic_auth_users:
    admin: $2b$12$hNf2lSsxfm0.i4a.1kVpSOVyBCfIB51VRjgBUyv6kdnyTlgWj81Ay
We change the permissions of the newly created file according to the group and user prometheus:
root@server:~/lucru# chown prometheus:prometheus /etc/prometheus/web.yml
root@server:~/lucru# chmod 640 /etc/prometheus/web.yml
root@server:~/lucru# ls -la /etc/prometheus/web.yml
-rw-r----- 1 prometheus prometheus 90 iul 30 12:32 /etc/prometheus/web.yml
As can be seen, only those in the prometheus group and the prometheus user have write and read permissions, respectively.
We check:
root@server:~/lucru# promtool check web-config /etc/prometheus/web.yml
/etc/prometheus/web.yml SUCCESS
root@server:~/lucru#
Now everything is okay, and we will continue by modifying the service startup file to include the new configuration file:
root@server:~/lucru# nano /etc/systemd/system/prometheus.servicewhich will become:
[Unit]
Description=Prometheus
Wants=network-online.target
After=network-online.target

[Service]
User=prometheus
Group=prometheus
Restart=always
Type=simple
ExecStart=/usr/local/bin/prometheus \
    --config.file=/etc/prometheus/prometheus.yml \
    --storage.tsdb.path=/var/lib/prometheus/ \
    --web.console.templates=/etc/prometheus/consoles \
    --web.console.libraries=/etc/prometheus/console_libraries \
    --web.config.file=/etc/prometheus/web.yml \
    --web.listen-address=:9091

[Install]
WantedBy=multi-user.target
After entering and saving, we will need to restart the prometheus service, but before that, we must inform systemd of the file modification:
root@server:~/lucru# systemctl daemon-reload
root@server:~/lucru# systemctl restart prometheus
We check:
root@server:~/lucru# systemctl status prometheus
● prometheus.service - Prometheus
     Loaded: loaded (/etc/systemd/system/prometheus.service; enabled; preset: enabled)
     Active: active (running) since Tue 2024-07-30 12:45:51 EEST; 2min 27s ago
   Main PID: 1370 (prometheus)
      Tasks: 8 (limit: 9254)
     Memory: 23.1M (peak: 23.6M)
        CPU: 203ms
     CGroup: /system.slice/prometheus.service
             └─1370 /usr/local/bin/prometheus --config.file=/etc/prometheus/prometheus.yml --storage.tsdb.path=/var/lib/prometheus/ --web.console.templates=/etc/prometheus/consoles --web.console.libraries=/etc/prometheus/console_libraries --web.config.file=/etc/prometheus/web.yml --web.listen-address=:9091

iul 30 12:45:51 server prometheus[1370]: ts=2024-07-30T09:45:51.724Z caller=head.go:793 level=info component=tsdb msg="WAL segment loaded" segment=1 maxSegment=2
iul 30 12:45:51 server prometheus[1370]: ts=2024-07-30T09:45:51.725Z caller=head.go:793 level=info component=tsdb msg="WAL segment loaded" segment=2 maxSegment=2
iul 30 12:45:51 server prometheus[1370]: ts=2024-07-30T09:45:51.725Z caller=head.go:830 level=info component=tsdb msg="WAL replay completed" checkpoint_replay_duration=82.818µs wal_replay_duration=34.995082ms wbl_replay_duration=286ns chunk_snapshot_load_duration=0s mmap_chunk_replay_duration=1.178866ms total_replay_duration=36.308914ms
iul 30 12:45:51 server prometheus[1370]: ts=2024-07-30T09:45:51.729Z caller=main.go:1169 level=info fs_type=EXT4_SUPER_MAGIC
iul 30 12:45:51 server prometheus[1370]: ts=2024-07-30T09:45:51.729Z caller=main.go:1172 level=info msg="TSDB started"
iul 30 12:45:51 server prometheus[1370]: ts=2024-07-30T09:45:51.729Z caller=main.go:1354 level=info msg="Loading configuration file" filename=/etc/prometheus/prometheus.yml
iul 30 12:45:51 server prometheus[1370]: ts=2024-07-30T09:45:51.730Z caller=main.go:1391 level=info msg="updated GOGC" old=100 new=75
iul 30 12:45:51 server prometheus[1370]: ts=2024-07-30T09:45:51.730Z caller=main.go:1402 level=info msg="Completed loading of configuration file" filename=/etc/prometheus/prometheus.yml totalDuration=869.298µs db_storage=2.04µs remote_storage=2.408µs web_handler=645ns query_engine=1.53µs scrape=304.354µs scrape_sd=47.653µs notify=33.597µs notify_sd=15.011µs rules=2.338µs tracing=10.638µs
iul 30 12:45:51 server prometheus[1370]: ts=2024-07-30T09:45:51.730Z caller=main.go:1133 level=info msg="Server is ready to receive web requests."
iul 30 12:45:51 server prometheus[1370]: ts=2024-07-30T09:45:51.730Z caller=manager.go:164 level=info component="rule manager" msg="Starting rule manager..."
We check:
root@server:~/lucru# curl --head http://localhost:9091/graph
HTTP/1.1 401 Unauthorized
Content-Type: text/plain; charset=utf-8
Www-Authenticate: Basic
X-Content-Type-Options: nosniff
Date: Tue, 30 Jul 2024 09:51:18 GMT
Content-Length: 13

root@server:~/lucru# curl -u admin --head http://localhost:9091/graph
Enter host password for user 'admin':
HTTP/1.1 405 Method Not Allowed
Allow: GET, OPTIONS
Content-Type: text/plain; charset=utf-8
X-Content-Type-Options: nosniff
Date: Tue, 30 Jul 2024 09:51:36 GMT
Content-Length: 19
As can be seen, from now on, anyone who wishes to access it will need to know the username and password.
Encrypted connection
Now the connection is secured in terms of connectivity, but we will also need to encrypt the connection (traffic) for safety. For this, we will need to generate a key pair as described on the page where we covered the installation of Grav SMC in Apache or refer to the keys created with certbot provided by the Let's Encrypt service; I have described here how the process works. After that, we will need to inform the prometheus service where to find the keys. The documentation can be found here :
We copy the necessary keys and change the permissions:
root@server:~/lucru# cp /etc/letsencrypt/live/meet.svgenebank.ro/privkey.pem /etc/prometheus
root@server:~/lucru# cp /etc/letsencrypt/live/meet.svgenebank.ro/fullchain.pem /etc/prometheus/
root@server:~/lucru# sudo chown prometheus:prometheus /etc/prometheus/*.pem
After that, we edit the configuration file web.yml:
root@server:~/lucru# nano /etc/prometheus/web.ymlSince I already have the service installed, I will add the path to the keys:
tls_server_config:
     cert_file: /etc/prometheus/fullchain.pem
     key_file: /etc/prometheus/privkey.pem
basic_auth_users:
    admin: $2b$12$hNf2lSsxfm0.i4a.1kVpSOVyBCfIB51VRjgBUyv6kdnyTlgWj81Ay
We restart the service and check that everything is in order:
root@server:~/lucru# systemctl restart prometheus.service
root@server:~/lucru# systemctl status prometheus.service
● prometheus.service - Prometheus
     Loaded: loaded (/etc/systemd/system/prometheus.service; enabled; preset: enabled)
     Active: active (running) since Tue 2024-07-30 14:01:39 EEST; 7min ago
   Main PID: 1922 (prometheus)
      Tasks: 8 (limit: 9254)
     Memory: 24.0M (peak: 36.9M)
        CPU: 851ms
     CGroup: /system.slice/prometheus.service
             └─1922 /usr/local/bin/prometheus --config.file=/etc/prometheus/prometheus.yml --storage.tsdb.path=/var/lib/prometheus/ --web.console.templates=/etc/prometheus/consoles --web.console.libraries=/etc/prometheus/console_libraries --web.config.file=/etc/prometheus/web.yml --web.listen-address=:9091

iul 30 14:01:39 server prometheus[1922]: ts=2024-07-30T11:01:39.923Z caller=main.go:1354 level=info msg="Loading configuration file" filename=/etc/prometheus/prometheus.yml
iul 30 14:01:39 server prometheus[1922]: ts=2024-07-30T11:01:39.924Z caller=main.go:1391 level=info msg="updated GOGC" old=100 new=75
iul 30 14:01:39 server prometheus[1922]: ts=2024-07-30T11:01:39.924Z caller=main.go:1402 level=info msg="Completed loading of configuration file" filename=/etc/prometheus/prometheus.yml totalDuration=944.966µs db_storage=2.311µs remote_storage=2.17µs web_handler=754ns query_engine=1.583µs scrape=303.16µs scrape_sd=57.684µs notify=43.396µs notify_sd=15.935µs rules=2.101µs tracing=10.241µs
iul 30 14:01:39 server prometheus[1922]: ts=2024-07-30T11:01:39.924Z caller=main.go:1133 level=info msg="Server is ready to receive web requests."
iul 30 14:01:39 server prometheus[1922]: ts=2024-07-30T11:01:39.924Z caller=manager.go:164 level=info component="rule manager" msg="Starting rule manager..."
iul 30 14:01:57 server prometheus[1922]: ts=2024-07-30T11:01:57.592Z caller=compact.go:576 level=info component=tsdb msg="write block" mint=1722326400000 maxt=1722333600000 ulid=01J41MVMN9H3DFTS1X55JNT201 duration=46.712363ms ooo=false
iul 30 14:01:57 server prometheus[1922]: ts=2024-07-30T11:01:57.596Z caller=head.go:1355 level=info component=tsdb msg="Head GC completed" caller=truncateMemory duration=3.875084ms
iul 30 14:01:57 server prometheus[1922]: ts=2024-07-30T11:01:57.597Z caller=checkpoint.go:101 level=info component=tsdb msg="Creating checkpoint" from_segment=0 to_segment=2 mint=1722333600000
iul 30 14:01:57 server prometheus[1922]: ts=2024-07-30T11:01:57.618Z caller=head.go:1317 level=info component=tsdb msg="WAL checkpoint complete" first=0 last=2 duration=21.576972ms
iul 30 14:02:13 server prometheus[1922]: ts=2024-07-30T11:02:13.801Z caller=stdlib.go:105 level=error component=web caller="http: TLS handshake error from 10.2.2.6:41698" msg="remote error: tls: bad certificate"
The message msg="remote error: tls: bad certificate" appears because the connection made is not trusted; I made the request through the internal IP and not through one of the domains for which I registered the respective key.
To resolve this issue, we edit the file /etc/hosts/ and add the private address of the machine and the domain name for which the Let's Encrypt key was registered, on the machine running prometheus and the machine where we run the browser:
On the server:
root@server:~/lucru# nano /etc/hostsWe edit:
127.0.0.1       localhost
::1             localhost ip6-localhost ip6-loopback
ff02::1         ip6-allnodes
ff02::2         ip6-allrouters
# --- BEGIN PVE ---
192.168.9.5 server.domeniu.local server
# --- END PVE ---
# --- Defined by me ---
192.168.9.5 server.domeniu.ro server
# --- END me ---
On the desktop:
florin@florin:~$ sudo nano /etc/hostsWe edit:
# Standard host addresses
127.0.0.1  localhost
::1        localhost ip6-localhost ip6-loopback
ff02::1    ip6-allnodes
ff02::2    ip6-allrouters
# This host address
127.0.1.1  florin
# --- Defined by me ---
192.168.9.5 server.domeniu.ro server
# --- END me ---
We also edit the configuration file of the systemd service:
root@server:~/lucru# nano /etc/systemd/system/prometheus.serviceWe add the line that informs about the external address --web.external-url=https://server.domeniu.ro:
[Unit]
Description=Prometheus
Wants=network-online.target
After=network-online.target

[Service]
User=prometheus
Group=prometheus
Restart=always
Type=simple
ExecStart=/usr/local/bin/prometheus \
    --config.file=/etc/prometheus/prometheus.yml \
    --storage.tsdb.path=/var/lib/prometheus/ \
    --web.console.templates=/etc/prometheus/consoles \
    --web.console.libraries=/etc/prometheus/console_libraries \
    --web.config.file=/etc/prometheus/web.yml \
    --web.external-url=https://server.domeniu.ro \
    --web.listen-address=:9091

[Install]
WantedBy=multi-user.target
We tell systemd that we have made changes and restart the service:
root@server:~/lucru# systemctl daemon-reload
root@server:~/lucru# systemctl restart prometheus.service
root@server:~/lucru# systemctl status prometheus.service
● prometheus.service - Prometheus
     Loaded: loaded (/etc/systemd/system/prometheus.service; enabled; preset: enabled)
     Active: active (running) since Tue 2024-07-30 14:48:20 EEST; 3min 22s ago
   Main PID: 2452 (prometheus)
      Tasks: 8 (limit: 9254)
     Memory: 18.1M (peak: 18.5M)
        CPU: 184ms
     CGroup: /system.slice/prometheus.service
             └─2452 /usr/local/bin/prometheus --config.file=/etc/prometheus/prometheus.yml --storage.tsdb.path=/var/lib/prometheus/ --web.console.templates=/etc/prometheus/consoles --web.console.libraries=/etc/prometheus/console_libraries --web.config.file=/etc/prometheus/web.yml --web.external-url=https://server.svgenebank.ro --web.listen-address=:9091

iul 30 14:48:21 server prometheus[2452]: ts=2024-07-30T11:48:21.017Z caller=head.go:793 level=info component=tsdb msg="WAL segment loaded" segment=6 maxSegment=7
iul 30 14:48:21 server prometheus[2452]: ts=2024-07-30T11:48:21.017Z caller=head.go:793 level=info component=tsdb msg="WAL segment loaded" segment=7 maxSegment=7
iul 30 14:48:21 server prometheus[2452]: ts=2024-07-30T11:48:21.017Z caller=head.go:830 level=info component=tsdb msg="WAL replay completed" checkpoint_replay_duration=6.475024ms wal_replay_duration=6.566701ms wbl_replay_duration=234ns chunk_snapshot_load_duration=0s mmap_chunk_replay_duration=14.614µs total_replay_duration=13.098473ms
iul 30 14:48:21 server prometheus[2452]: ts=2024-07-30T11:48:21.021Z caller=main.go:1169 level=info fs_type=EXT4_SUPER_MAGIC
iul 30 14:48:21 server prometheus[2452]: ts=2024-07-30T11:48:21.022Z caller=main.go:1172 level=info msg="TSDB started"
iul 30 14:48:21 server prometheus[2452]: ts=2024-07-30T11:48:21.022Z caller=main.go:1354 level=info msg="Loading configuration file" filename=/etc/prometheus/prometheus.yml
iul 30 14:48:21 server prometheus[2452]: ts=2024-07-30T11:48:21.022Z caller=main.go:1391 level=info msg="updated GOGC" old=100 new=75
iul 30 14:48:21 server prometheus[2452]: ts=2024-07-30T11:48:21.022Z caller=main.go:1402 level=info msg="Completed loading of configuration file" filename=/etc/prometheus/prometheus.yml totalDuration=931.749µs db_storage=1.9µs remote_storage=1.923µs web_handler=730ns query_engine=1.841µs scrape=409.055µs scrape_sd=35.348µs notify=40.986µs notify_sd=14.587µs rules=2.452µs tracing=10.609µs
iul 30 14:48:21 server prometheus[2452]: ts=2024-07-30T11:48:21.023Z caller=main.go:1133 level=info msg="Server is ready to receive web requests."
iul 30 14:48:21 server prometheus[2452]: ts=2024-07-30T11:48:21.023Z caller=manager.go:164 level=info component="rule manager" msg="Starting rule manager..."
We are checking on the server:
root@server:~/lucru# curl -u admin --cacert /etc/prometheus/fullchain.pem https://server.domeniu.ro:9091/
Enter host password for user 'admin':
<a href="/graph">Found</a>.
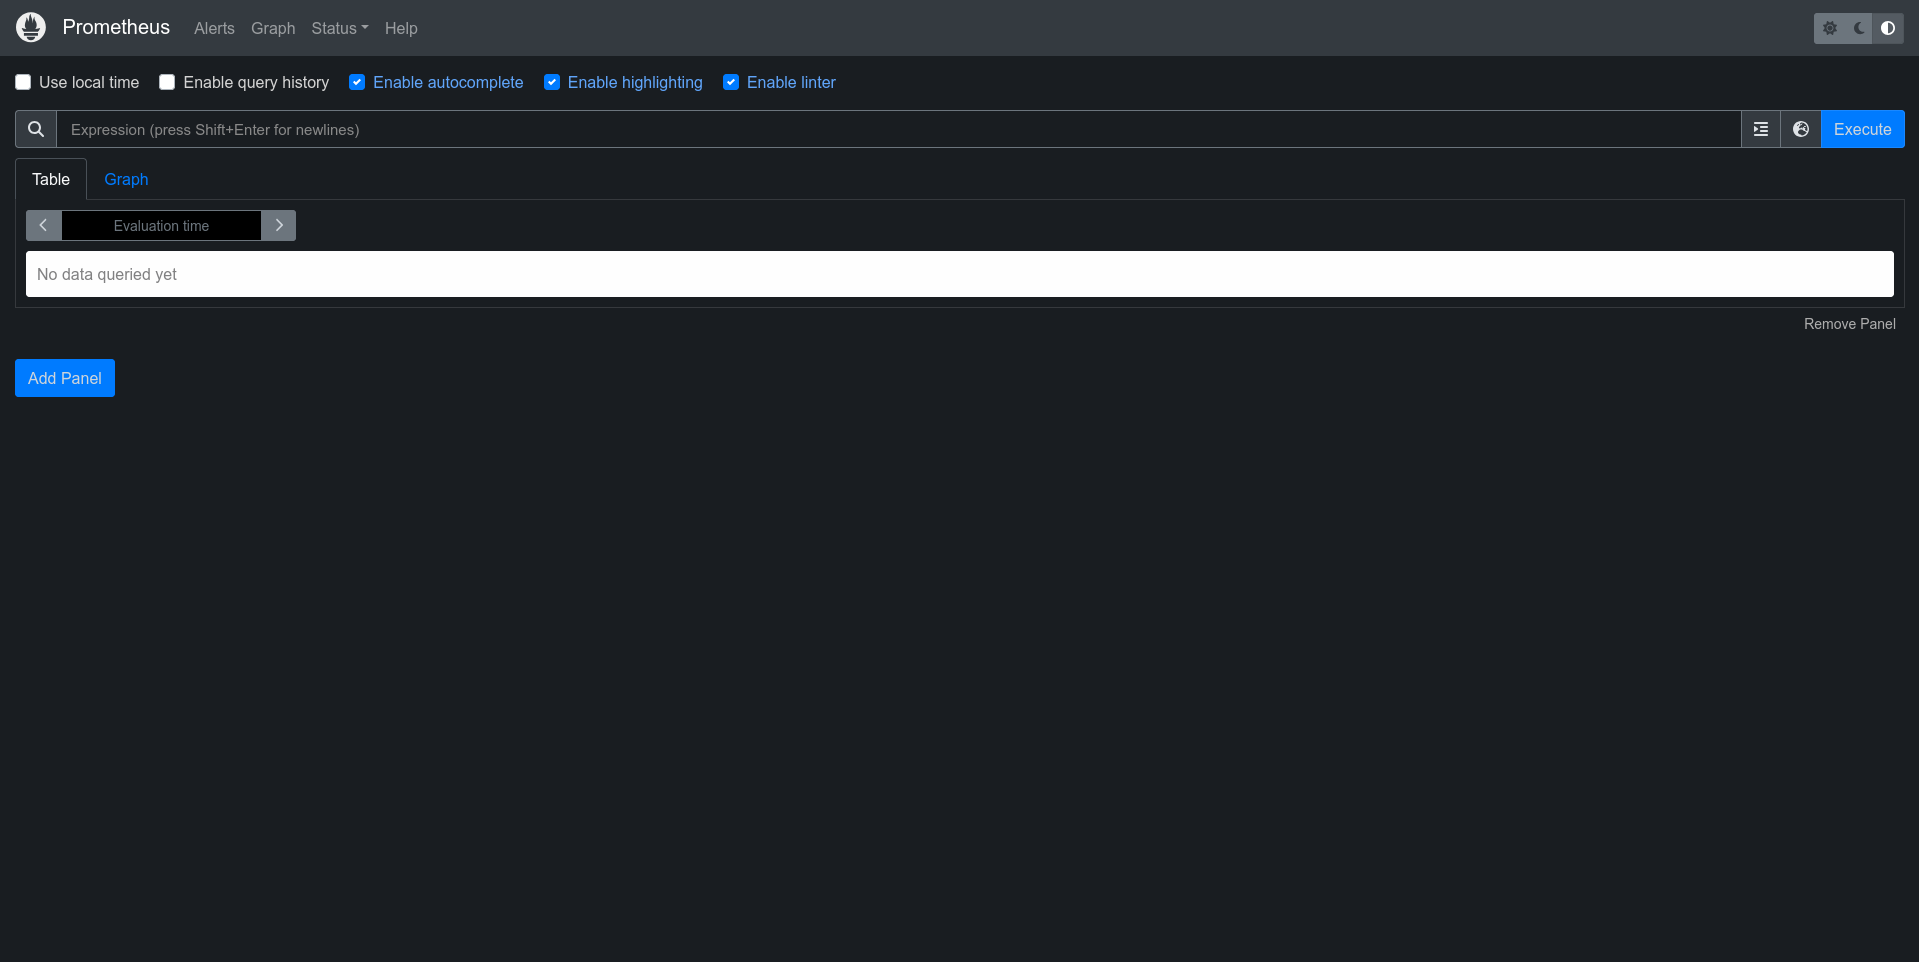
root@server:~/lucru# We are checking on the desktop, using a browser, at the address https://server.domeniu.ro:9091:
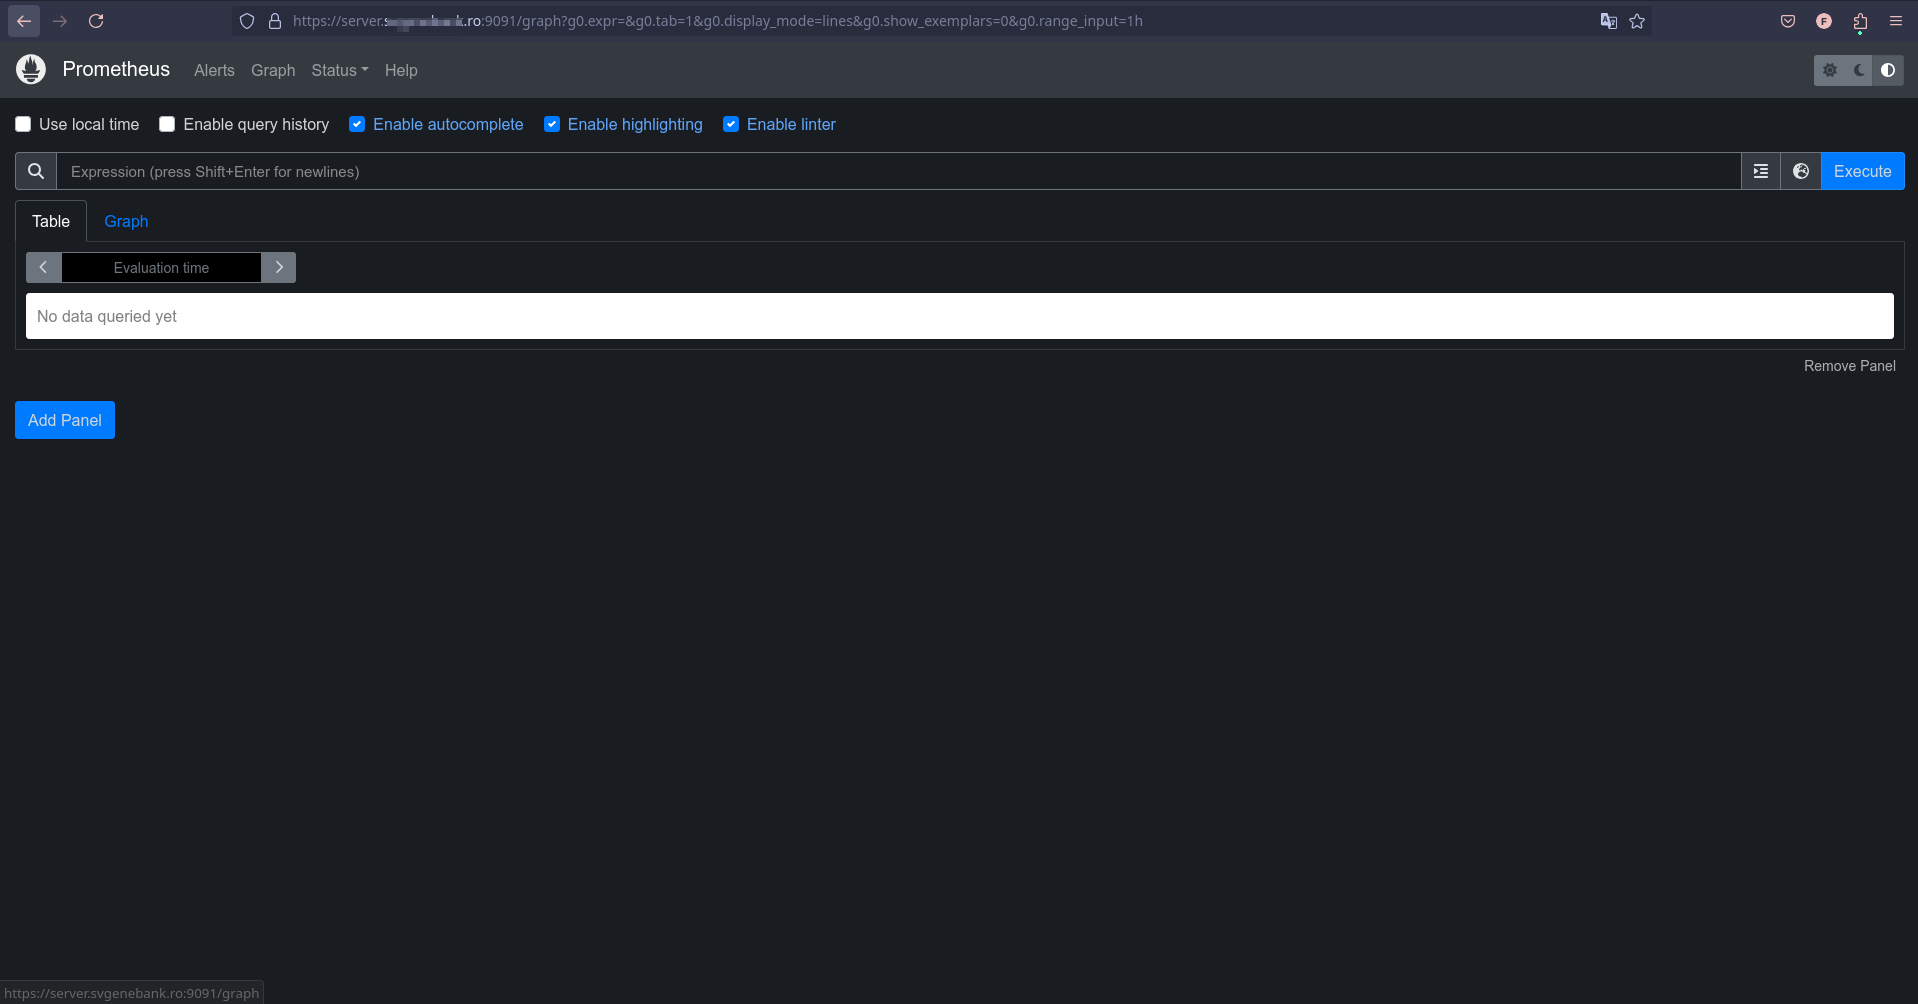
Now everything works as expected.
Usage
For usage, for the purpose of monitoring the server, we will use node exporter to send metrics to prometheus. Initially, we will copy the link to the latest version of node exporter from here :
root@server:~/lucru# wget https://github.com/prometheus/node_exporter/releases/download/v1.8.2/node_exporter-1.8.2.linux-amd64.tar.gz
--2024-07-31 08:42:55--  https://github.com/prometheus/node_exporter/releases/download/v1.8.2/node_exporter-1.8.2.linux-amd64.tar.gz
Resolving github.com (github.com)... 140.82.121.4
Connecting to github.com (github.com)|140.82.121.4|:443... connected.
HTTP request sent, awaiting response... 302 Found
Location: https://objects.githubusercontent.com/github-production-release-asset-2e65be/9524057/a7e04f41-5543-40e2-9060-26fefe32bb4b?X-Amz-Algorithm=AWS4-HMAC-SHA256&X-Amz-Credential=releaseassetproduction%2F20240731%2Fus-east-1%2Fs3%2Faws4_request&X-Amz-Date=20240731T054256Z&X-Amz-Expires=300&X-Amz-Signature=a65bacf3edbfde8444cf01bd2e00a449438b15e0807c43f167d33232e377c086&X-Amz-SignedHeaders=host&actor_id=0&key_id=0&repo_id=9524057&response-content-disposition=attachment%3B%20filename%3Dnode_exporter-1.8.2.linux-amd64.tar.gz&response-content-type=application%2Foctet-stream [following]
--2024-07-31 08:42:56--  https://objects.githubusercontent.com/github-production-release-asset-2e65be/9524057/a7e04f41-5543-40e2-9060-26fefe32bb4b?X-Amz-Algorithm=AWS4-HMAC-SHA256&X-Amz-Credential=releaseassetproduction%2F20240731%2Fus-east-1%2Fs3%2Faws4_request&X-Amz-Date=20240731T054256Z&X-Amz-Expires=300&X-Amz-Signature=a65bacf3edbfde8444cf01bd2e00a449438b15e0807c43f167d33232e377c086&X-Amz-SignedHeaders=host&actor_id=0&key_id=0&repo_id=9524057&response-content-disposition=attachment%3B%20filename%3Dnode_exporter-1.8.2.linux-amd64.tar.gz&response-content-type=application%2Foctet-stream
Resolving objects.githubusercontent.com (objects.githubusercontent.com)... 185.199.109.133, 185.199.110.133, 185.199.111.133, ...
Connecting to objects.githubusercontent.com (objects.githubusercontent.com)|185.199.109.133|:443... connected.
HTTP request sent, awaiting response... 200 OK
Length: 10676343 (10M) [application/octet-stream]
Saving to: ‘node_exporter-1.8.2.linux-amd64.tar.gz’

node_exporter-1.8.2.linux-amd 100%[=================================================>]  10,18M  9,46MB/s    in 1,1s

2024-07-31 08:42:58 (9,46 MB/s) - ‘node_exporter-1.8.2.linux-amd64.tar.gz’ saved [10676343/10676343]
After the download is complete, we will extract the file as follows:
root@server:~/lucru# tar xvfz node_exporter-1.8.2.linux-amd64.tar.gz
node_exporter-1.8.2.linux-amd64/
node_exporter-1.8.2.linux-amd64/NOTICE
node_exporter-1.8.2.linux-amd64/node_exporter
node_exporter-1.8.2.linux-amd64/LICENSE
root@server:~/lucru#
The node_exporter application uses port 9100 by default. Before use, we check if port 9100 is not in use:
root@server:~/lucru# netstat -tulpn | grep 9100
root@server:~/lucru#
If it is not in use, we check that the binary file node_exporter is running:
root@server:~/lucru# cd node_exporter-1.8.2.linux-amd64/
root@server:~/lucru/node_exporter-1.8.2.linux-amd64# ./node_exporter
ts=2024-07-31T05:56:07.310Z caller=node_exporter.go:193 level=info msg="Starting node_exporter" version="(version=1.8.2, branch=HEAD, revision=f1e0e8360aa60b6cb5e5cc1560bed348fc2c1895)"
ts=2024-07-31T05:56:07.310Z caller=node_exporter.go:194 level=info msg="Build context" build_context="(go=go1.22.5, platform=linux/amd64, user=root@03d440803209, date=20240714-11:53:45, tags=unknown)"
ts=2024-07-31T05:56:07.310Z caller=node_exporter.go:196 level=warn msg="Node Exporter is running as root user. This exporter is designed to run as unprivileged user, root is not required."
ts=2024-07-31T05:56:07.313Z caller=filesystem_common.go:111 level=info collector=filesystem msg="Parsed flag --collector.filesystem.mount-points-exclude" flag=^/(dev|proc|run/credentials/.+|sys|var/lib/docker/.+|var/lib/containers/storage/.+)($|/)
ts=2024-07-31T05:56:07.313Z caller=filesystem_common.go:113 level=info collector=filesystem msg="Parsed flag --collector.filesystem.fs-types-exclude" flag=^(autofs|binfmt_misc|bpf|cgroup2?|configfs|debugfs|devpts|devtmpfs|fusectl|hugetlbfs|iso9660|mqueue|nsfs|overlay|proc|procfs|pstore|rpc_pipefs|securityfs|selinuxfs|squashfs|sysfs|tracefs)$
ts=2024-07-31T05:56:07.313Z caller=diskstats_common.go:111 level=info collector=diskstats msg="Parsed flag --collector.diskstats.device-exclude" flag=^(z?ram|loop|fd|(h|s|v|xv)d[a-z]|nvme\d+n\d+p)\d+$
ts=2024-07-31T05:56:07.313Z caller=diskstats_linux.go:265 level=error collector=diskstats msg="Failed to open directory, disabling udev device properties" path=/run/udev/data
ts=2024-07-31T05:56:07.314Z caller=node_exporter.go:111 level=info msg="Enabled collectors"
ts=2024-07-31T05:56:07.314Z caller=node_exporter.go:118 level=info collector=arp
ts=2024-07-31T05:56:07.314Z caller=node_exporter.go:118 level=info collector=bcache
ts=2024-07-31T05:56:07.314Z caller=node_exporter.go:118 level=info collector=bonding
ts=2024-07-31T05:56:07.314Z caller=node_exporter.go:118 level=info collector=btrfs
ts=2024-07-31T05:56:07.314Z caller=node_exporter.go:118 level=info collector=conntrack
ts=2024-07-31T05:56:07.314Z caller=node_exporter.go:118 level=info collector=cpu
ts=2024-07-31T05:56:07.314Z caller=node_exporter.go:118 level=info collector=cpufreq
ts=2024-07-31T05:56:07.314Z caller=node_exporter.go:118 level=info collector=diskstats
#............ and more lines................
We open a new connection via ssh or a new console to check:
florin@server:~$ curl http://localhost:9100/metrics | grep node_cpu
  % Total    % Received % Xferd  Average Speed   Time    Time     Time  Current
                                 Dload  Upload   Total   Spent    Left  Speed
  0     0    0     0    0     0      0      0 --:--:-- --:--:-- --:--:--     0# HELP node_cpu_core_throttles_total Number of times this CPU core has been throttled.
# TYPE node_cpu_core_throttles_total counter
node_cpu_core_throttles_total{core="0",package="0"} 0
node_cpu_core_throttles_total{core="1",package="0"} 0
node_cpu_core_throttles_total{core="2",package="0"} 0
node_cpu_core_throttles_total{core="3",package="0"} 0
# HELP node_cpu_frequency_max_hertz Maximum CPU thread frequency in hertz.
# TYPE node_cpu_frequency_max_hertz gauge
node_cpu_frequency_max_hertz{cpu="0"} 2.7e+09
node_cpu_frequency_max_hertz{cpu="1"} 2.7e+09
node_cpu_frequency_max_hertz{cpu="2"} 2.7e+09
node_cpu_frequency_max_hertz{cpu="3"} 2.7e+09
# HELP node_cpu_frequency_min_hertz Minimum CPU thread frequency in hertz.
# TYPE node_cpu_frequency_min_hertz gauge
node_cpu_frequency_min_hertz{cpu="0"} 8e+08
node_cpu_frequency_min_hertz{cpu="1"} 8e+08
node_cpu_frequency_min_hertz{cpu="2"} 8e+08
node_cpu_frequency_min_hertz{cpu="3"} 8e+08
# HELP node_cpu_guest_seconds_total Seconds the CPUs spent in guests (VMs) for each mode.
# TYPE node_cpu_guest_seconds_total counter
node_cpu_guest_seconds_total{cpu="0",mode="nice"} 0
node_cpu_guest_seconds_total{cpu="0",mode="user"} 1996.24
node_cpu_guest_seconds_total{cpu="1",mode="nice"} 0
node_cpu_guest_seconds_total{cpu="1",mode="user"} 1918.58
# HELP node_cpu_package_throttles_total Number of times this CPU package has been throttled.
# TYPE node_cpu_package_throttles_total counter
node_cpu_package_throttles_total{package="0"} 0
# HELP node_cpu_scaling_frequency_hertz Current scaled CPU thread frequency in hertz.
# TYPE node_cpu_scaling_frequency_hertz gauge
node_cpu_scaling_frequency_hertz{cpu="0"} 2.59584e+09
node_cpu_scaling_frequency_hertz{cpu="1"} 2.595771e+09
node_cpu_scaling_frequency_hertz{cpu="2"} 2.595751e+09
node_cpu_scaling_frequency_hertz{cpu="3"} 2.595957e+09
# HELP node_cpu_scaling_frequency_max_hertz Maximum scaled CPU thread frequency in hertz.
# TYPE node_cpu_scaling_frequency_max_hertz gauge
node_cpu_scaling_frequency_max_hertz{cpu="0"} 2.7e+09
node_cpu_scaling_frequency_max_hertz{cpu="1"} 2.7e+09
node_cpu_scaling_frequency_max_hertz{cpu="2"} 2.7e+09
node_cpu_scaling_frequency_max_hertz{cpu="3"} 2.7e+09
# HELP node_cpu_scaling_frequency_min_hertz Minimum scaled CPU thread frequency in hertz.
# TYPE node_cpu_scaling_frequency_min_hertz gauge
node_cpu_scaling_frequency_min_hertz{cpu="0"} 8e+08
node_cpu_scaling_frequency_min_hertz{cpu="1"} 8e+08
node_cpu_scaling_frequency_min_hertz{cpu="2"} 8e+08
node_cpu_scaling_frequency_min_hertz{cpu="3"} 8e+08
# HELP node_cpu_scaling_governor Current enabled CPU frequency governor.
# TYPE node_cpu_scaling_governor gauge
node_cpu_scaling_governor{cpu="0",governor="conservative"} 0
node_cpu_scaling_governor{cpu="0",governor="ondemand"} 0
node_cpu_scaling_governor{cpu="0",governor="performance"} 1
node_cpu_scaling_governor{cpu="0",governor="powersave"} 0
node_cpu_scaling_governor{cpu="0",governor="schedutil"} 0
node_cpu_scaling_governor{cpu="0",governor="userspace"} 0
node_cpu_scaling_governor{cpu="1",governor="conservative"} 0
node_cpu_scaling_governor{cpu="1",governor="ondemand"} 0
node_cpu_scaling_governor{cpu="1",governor="performance"} 1
node_cpu_scaling_governor{cpu="1",governor="powersave"} 0
node_cpu_scaling_governor{cpu="1",governor="schedutil"} 0
node_cpu_scaling_governor{cpu="1",governor="userspace"} 0
node_cpu_scaling_governor{cpu="2",governor="conservative"} 0
node_cpu_scaling_governor{cpu="2",governor="ondemand"} 0
node_cpu_scaling_governor{cpu="2",governor="performance"} 1
node_cpu_scaling_governor{cpu="2",governor="powersave"} 0
node_cpu_scaling_governor{cpu="2",governor="schedutil"} 0
node_cpu_scaling_governor{cpu="2",governor="userspace"} 0
node_cpu_scaling_governor{cpu="3",governor="conservative"} 0
node_cpu_scaling_governor{cpu="3",governor="ondemand"} 0
node_cpu_scaling_governor{cpu="3",governor="performance"} 1
node_cpu_scaling_governor{cpu="3",governor="powersave"} 0
node_cpu_scaling_governor{cpu="3",governor="schedutil"} 0
node_cpu_scaling_governor{cpu="3",governor="userspace"} 0
# HELP node_cpu_seconds_total Seconds the CPUs spent in each mode.
# TYPE node_cpu_seconds_total counter
node_cpu_seconds_total{cpu="0",mode="idle"} 74133.32
node_cpu_seconds_total{cpu="0",mode="iowait"} 19.29
node_cpu_seconds_total{cpu="0",mode="irq"} 0
node_cpu_seconds_total{cpu="0",mode="nice"} 0.09
node_cpu_seconds_total{cpu="0",mode="softirq"} 16.54
node_cpu_seconds_total{cpu="0",mode="steal"} 0
node_cpu_seconds_total{cpu="0",mode="system"} 944.16
node_cpu_seconds_total{cpu="0",mode="user"} 3142.01
node_cpu_seconds_total{cpu="1",mode="idle"} 74352.61
node_cpu_seconds_total{cpu="1",mode="iowait"} 19.56
node_cpu_seconds_total{cpu="1",mode="irq"} 0
node_cpu_seconds_total{cpu="1",mode="nice"} 0.12
node_cpu_seconds_total{cpu="1",mode="softirq"} 11.89
node_cpu_seconds_total{cpu="1",mode="steal"} 0
node_cpu_seconds_total{cpu="1",mode="system"} 978.31
node_cpu_seconds_total{cpu="1",mode="user"} 3033.93
100  131k    0  131k    0     0  1529k      0 --:--:-- --:--:-- --:--:-- 1533k
florin@server:~$
We observe that it works and we stop the execution with CTRL+C. We copy the binary file to /usr/local/bin/:
root@server:~/lucru/node_exporter-1.8.2.linux-amd64# cp node_exporter /usr/local/bin/We create the necessary file for systemd so that node_exporter runs as a service:
root@server:~/lucru/node_exporter-1.8.2.linux-amd64# nano /etc/systemd/system/node_exporter.serviceIn which we will insert the following lines of code:
[Unit]
Description=Node Exporter
After=network.target

[Service]
User=prometheus
Group=prometheus
Type=simple
ExecStart=/usr/local/bin/node_exporter

[Install]
WantedBy=multi-user.target
After saving and closing, we will inform systemd of the addition of the new file:
root@server:~/lucru/node_exporter-1.8.2.linux-amd64# systemctl daemon-reloadAfter which we will set the service node_exporter to start at boot, and then we will start the service immediately, after which we will check:
root@server:~/lucru/node_exporter-1.8.2.linux-amd64# systemctl enable --now node_exporter
Created symlink /etc/systemd/system/multi-user.target.wants/node_exporter.service → /etc/systemd/system/node_exporter.service.
root@server:~/lucru/node_exporter-1.8.2.linux-amd64# systemctl status node_exporter
● node_exporter.service - Node Exporter
     Loaded: loaded (/etc/systemd/system/node_exporter.service; enabled; preset: enabled)
     Active: active (running) since Wed 2024-07-31 10:23:39 EEST; 29s ago
   Main PID: 10384 (node_exporter)
      Tasks: 4 (limit: 9254)
     Memory: 2.5M (peak: 2.6M)
        CPU: 14ms
     CGroup: /system.slice/node_exporter.service
             └─10384 /usr/local/bin/node_exporter

iul 31 10:23:39 server node_exporter[10384]: ts=2024-07-31T07:23:39.457Z caller=node_exporter.go:118 level=info collector=time
iul 31 10:23:39 server node_exporter[10384]: ts=2024-07-31T07:23:39.457Z caller=node_exporter.go:118 level=info collector=timex
iul 31 10:23:39 server node_exporter[10384]: ts=2024-07-31T07:23:39.457Z caller=node_exporter.go:118 level=info collector=udp_queues
iul 31 10:23:39 server node_exporter[10384]: ts=2024-07-31T07:23:39.457Z caller=node_exporter.go:118 level=info collector=uname
iul 31 10:23:39 server node_exporter[10384]: ts=2024-07-31T07:23:39.457Z caller=node_exporter.go:118 level=info collector=vmstat
iul 31 10:23:39 server node_exporter[10384]: ts=2024-07-31T07:23:39.457Z caller=node_exporter.go:118 level=info collector=watchdog
iul 31 10:23:39 server node_exporter[10384]: ts=2024-07-31T07:23:39.457Z caller=node_exporter.go:118 level=info collector=xfs
iul 31 10:23:39 server node_exporter[10384]: ts=2024-07-31T07:23:39.457Z caller=node_exporter.go:118 level=info collector=zfs
iul 31 10:23:39 server node_exporter[10384]: ts=2024-07-31T07:23:39.458Z caller=tls_config.go:313 level=info msg="Listening on" address=[::]:9100
iul 31 10:23:39 server node_exporter[10384]: ts=2024-07-31T07:23:39.458Z caller=tls_config.go:316 level=info msg="TLS is disabled." http2=false address=[::]:9100
As we can see, everything is functional so far.
We inform prometheus where to find the relevant metrics for our server by editing /etc/prometheus/prometheus.yml:
root@server:~/lucru/node_exporter-1.8.2.linux-amd64# nano /etc/prometheus/prometheus.ymlwhich will look like:
# my global config
global:
  scrape_interval: 15s # Set the scrape interval to every 15 seconds. Default is every 1 minute.
  evaluation_interval: 15s # Evaluate rules every 15 seconds. The default is every 1 minute.
  # scrape_timeout is set to the global default (10s).

# Alertmanager configuration
alerting:
  alertmanagers:
    - static_configs:
        - targets:
          # - alertmanager:9093

# Load rules once and periodically evaluate them according to the global 'evaluation_interval'.
rule_files:
  # - "first_rules.yml"
  # - "second_rules.yml"

# A scrape configuration containing exactly one endpoint to scrape:
# Here it's Prometheus itself.
scrape_configs:
  # The job name is added as a label `job=<job_name>` to any timeseries scraped from this config.
  - job_name: "prometheus"

    # metrics_path defaults to '/metrics'
    # scheme defaults to 'http'.
    scheme: https
    basic_auth:
      username: admin
      password: PasswordForAdmin
    static_configs:
      - targets: ["server.domeniu.ro:9091"]

  - job_name: 'node_server_ubuntu'
    static_configs:
      - targets: ['localhost:9100']
We restart the prometheus service after verification:
root@server:~/lucru/node_exporter-1.8.2.linux-amd64# systemctl restart prometheus.service
root@server:~/lucru/node_exporter-1.8.2.linux-amd64# systemctl status prometheus.service
● prometheus.service - Prometheus
Loaded: loaded (/etc/systemd/system/prometheus.service; enabled; preset: enabled)
Active: active (running) since Wed 2024-07-31 10:55:28 EEST; 2min 10s ago
Main PID: 10754 (prometheus)
Tasks: 8 (limit: 9254)
Memory: 20.9M (peak: 21.3M)
CPU: 197ms
CGroup: /system.slice/prometheus.service
└─10754 /usr/local/bin/prometheus --config.file=/etc/prometheus/prometheus.yml --storage.tsdb.path=/var/lib/prometheus/ --web.console.templates=/etc/prometheus/consoles --web.console.libraries=/etc/prometheus/console_libraries --web.config.file=/etc/prometheus/web.yml --web.external-url=https://server.svgenebank.ro --web.listen-address=:9091
iul 31 10:55:28 server prometheus[10754]: ts=2024-07-31T07:55:28.849Z caller=head.go:793 level=info component=tsdb msg="WAL segment loaded" segment=18 maxSegment=19
iul 31 10:55:28 server prometheus[10754]: ts=2024-07-31T07:55:28.850Z caller=head.go:793 level=info component=tsdb msg="WAL segment loaded" segment=19 maxSegment=19
iul 31 10:55:28 server prometheus[10754]: ts=2024-07-31T07:55:28.850Z caller=head.go:830 level=info component=tsdb msg="WAL replay completed" checkpoint_replay_duration=3.449735ms wal_replay_duration=5.111667ms wbl_replay_duration=250ns chunk_snapshot_load_duration=0s mmap_chunk_replay_duration=29.216µs total_replay_duration=8.632321ms
iul 31 10:55:28 server prometheus[10754]: ts=2024-07-31T07:55:28.853Z caller=main.go:1169 level=info fs_type=EXT4_SUPER_MAGIC
iul 31 10:55:28 server prometheus[10754]: ts=2024-07-31T07:55:28.853Z caller=main.go:1172 level=info msg="TSDB started"
iul 31 10:55:28 server prometheus[10754]: ts=2024-07-31T07:55:28.853Z caller=main.go:1354 level=info msg="Loading configuration file" filename=/etc/prometheus/prometheus.yml
iul 31 10:55:28 server prometheus[10754]: ts=2024-07-31T07:55:28.854Z caller=main.go:1391 level=info msg="updated GOGC" old=100 new=75
iul 31 10:55:28 server prometheus[10754]: ts=2024-07-31T07:55:28.854Z caller=main.go:1402 level=info msg="Completed loading of configuration file" filename=/etc/prometheus/prometheus.yml totalDuration=1.004923ms db_storage=1.872µs remote_storage=2.184µs web_handler=731ns query_engine=1.732µs scrape=443.048µs scrape_sd=39.908µs notify=38.974µs notify_sd=14.886µs rules=2.372µs tracing=10.537µs
iul 31 10:55:28 server prometheus[10754]: ts=2024-07-31T07:55:28.854Z caller=main.go:1133 level=info msg="Server is ready to receive web requests."
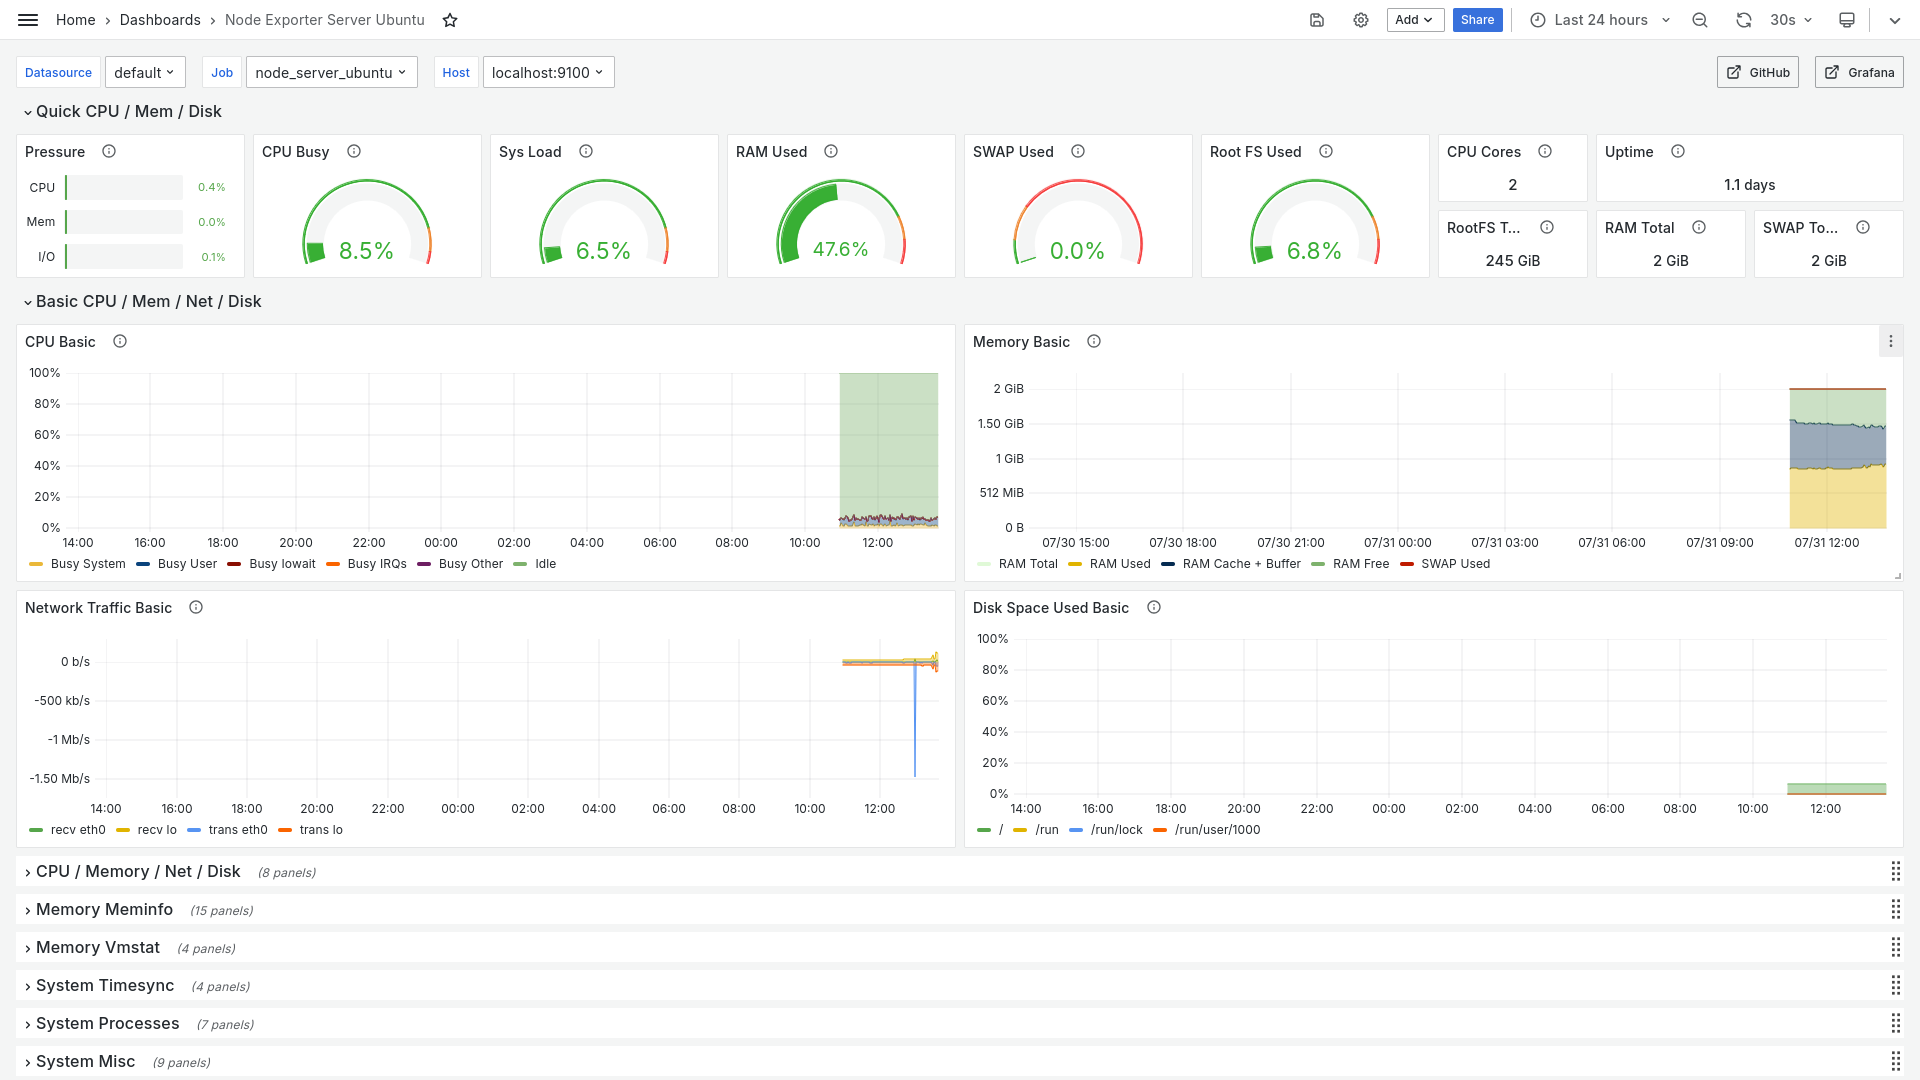
iul 31 10:55:28 server prometheus[10754]: ts=2024-07-31T07:55:28.854Z caller=manager.go:164 level=info component="rule manager" msg="Starting rule manager..."If we have the grafana service installed, we will also be able to see it graphically, in a pleasant way: