Grafana
Grafana is an open-source server/service developed for time-series data analysis.
Together with InfluxDB, Grafana makes a great team for data analysis and visualization.
Installing Grafana - Debian 9
Attention: As of 01/05/2019, the address of the package server has changed.
All the commands below are executed by the root user or by a user with administrative rights (for example, using the sudo command).
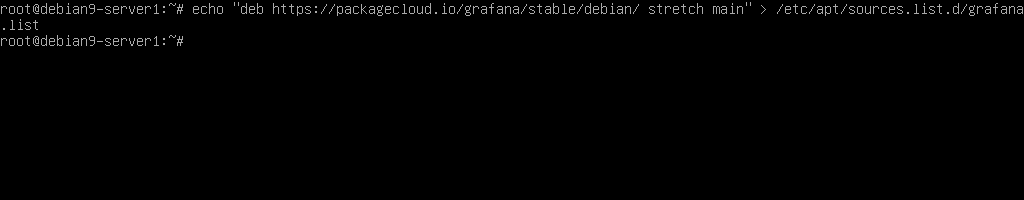
To start, we will create the file with the list where the repository of the files to be installed is located, this time without using an editor, using the command:
echo "deb https://packagecloud.io/grafana/stable/debian/ stretch main" > /etc/apt/sources.list.d/grafana.list
echo "deb https://packages.grafana.com/oss/deb stable main" > /etc/apt/sources.list.d/grafana.list
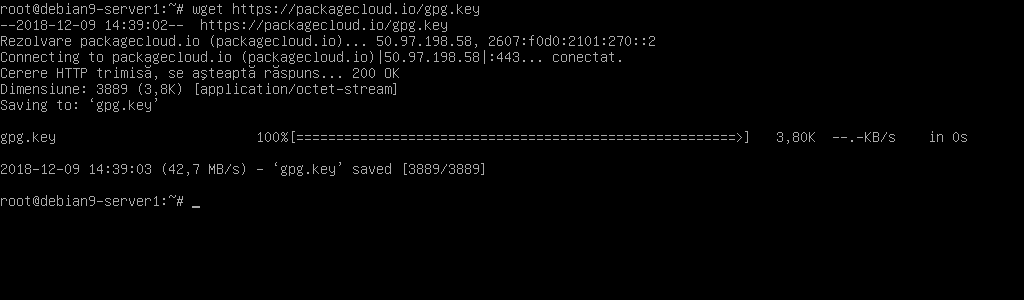
We are downloading the key:
wget https://packagecloud.io/gpg.key
wget https://packages.grafana.com/gpg.key
We are installing the key:
apt-key add gpg.key

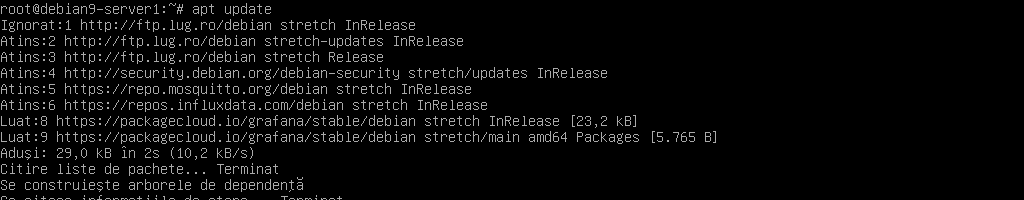
We are updating the package list:
apt update
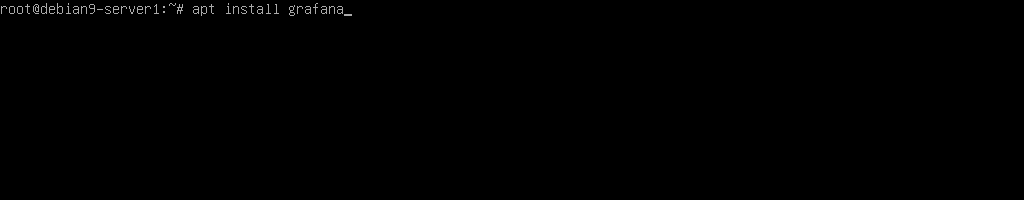
We are installing the grafana server/service:
apt install grafana
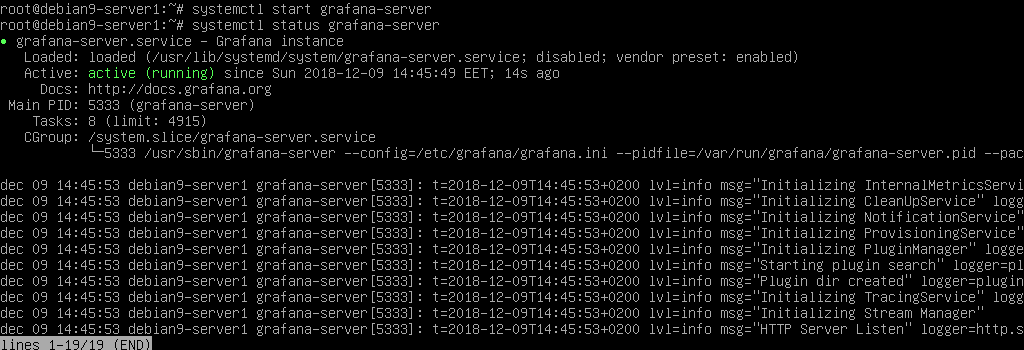
We check if the grafana-server service/server is running:
systemctl status grafana-server

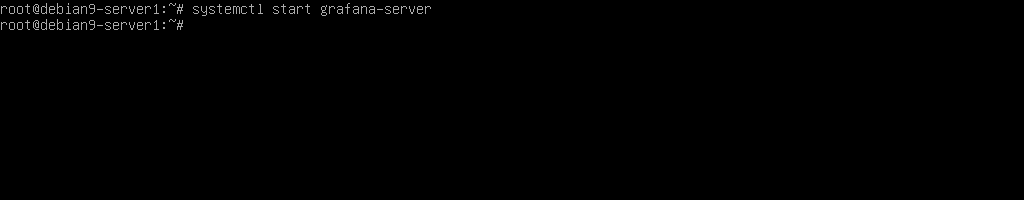
We start the grafana-server service/server:
systemctl start grafana-server
We check if the grafana-server service/server is running:
systemctl status grafana-server
To ensure the service starts automatically with the system boot, we also run the command
systemctl enable grafana-server

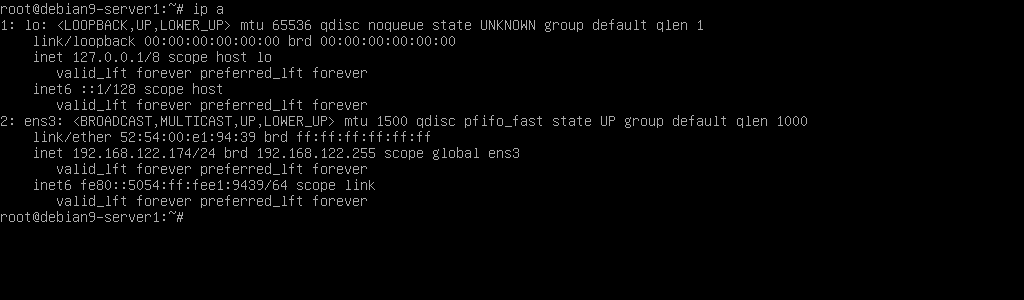
For configuration purposes, we determine the IP address of the computer where grafana-server is running:
ip a
We log in for the first time to the service provided by grafana, using admin as the username and admin as the password, after which we will be required to enter a different password for the admin user:

We add the data source by selecting the type of source, in this case InfluxDB:

We configure Grafana with the login details created earlier, in this case the database user: grafana and the database: espduino:


Attention: Most of the time, errors are due to login issues caused by the absence of the user or the database.
Initially, I was getting errors due to the absence of the database espduino. From the analysis of the InfluxDB server, I found the absence of this database and fixed the error by creating the database espduino, as shown in the image below:
The commands are:
//we enter the InfluxDB server
influx
//we display the databases present on the server
show database
//if we find the absence of the database, we create it
create database espduino
//we exit the database console
quit

After that, we press the Back button and we already have the first data source created to which Grafana has connected:
